Stiff diagram
A Stiff diagram, or Stiff pattern, is a graphical representation of chemical analyses, first developed by H.A. Stiff in 1951. It is widely used by hydrogeologists and geochemists to display the major ion composition of a water sample. A polygonal shape is created from four parallel horizontal axes extending on either side of a vertical zero axis. Cations are plotted in milliequivalents per liter on the left side of the zero axis, one to each horizontal axis, and anions are plotted on the right side. Stiff patterns are useful in making a rapid visual comparison between water from different sources. An alternative to the Stiff diagram is the Maucha diagram.
Stiff diagrams can be used:
- 1) to help visualize ionically related waters from which a flow path can be determined, or;
- 2) if the flow path is known, to show how the ionic composition of a water body changes over space and/or time.
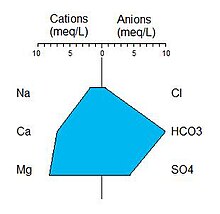
A typical Stiff diagram is shown in the figure (right). By standard convention, Stiff diagrams are created by plotting the equivalent concentration of the cations to the left of the center axis and anions to the right. The points are connected to form the figure. When comparing Stiff diagrams between different waters it is important to prepare each diagram using the same ionic species, in the same order, on the same scale.
Environmental laboratories typically report concentrations for anion and cation parameters using units of mass/volume, usually mg/L. In order to convert the mass concentration to an equivalent concentration the following mathematical relationship is used:
- (mass concentration) * (ionic charge) / (molecular weight) = (equivalent concentration)
For example, a water with a calcium concentration of 120 mg/L would have the following calcium equivalent concentration:
- (120 mg/L) * (2 meq/mmol) / (40 mg/mmol) = 6 meq/L
Software programs in common use
- HyCA Commercial software available from KWR waterware
- AqQA Commercial software available from RockWare, Inc.
- AquaChem Commercial software from Schlumberger Water Services
- ChemPoint Pro Commercial software from Starpoint software, Inc.
- Sanitas Commercial software from Sanitas Technologies LLC
- The Geochemist's Workbench Commercial software from Aqueous Solutions LLC
- GWB Community Edition Free community edition of the popular geochemical modeling software package.
- RockWorks Utilities Commercial software from RockWare, Inc.
- EnviroInsite Commercial software from HydroAnalysis, Inc.
- Python Scripts Free open-source Python scripts that can plot stiff diagrams.
References
- Fetter. Applied Hydrogeology, 4th Edition. 2001. p. 376
- Drever, James I. The Geochemistry of Natural Waters, Surface and Groundwater Environments, Third Edition. Upper Saddle River, NJ: Prentice Hall, 2002.
- Stiff, H.A., Jr., 1951, The interpretation of chemical water analysis by means of patterns: Journal of Petroleum Technology, v. 3. no. 10, section 1: p15,16 and section 2: p3.


