In probability and statistics, the skewed generalized "t" distribution is a family of continuous probability distributions. The distribution was first introduced by Panayiotis Theodossiou[1] in 1998. The distribution has since been used in different applications.[2][3][4][5][6][7] There are different parameterizations for the skewed generalized t distribution.[1][5]
Definition
Probability density function
where is the beta function, is the location parameter, is the scale parameter, is the skewness parameter, and and are the parameters that control the kurtosis. and are not parameters, but functions of the other parameters that are used here to scale or shift the distribution appropriately to match the various parameterizations of this distribution.
In the original parameterization[1] of the skewed generalized t distribution,
and
.
These values for and yield a distribution with mean of if and a variance of if . In order for to take on this value however, it must be the case that . Similarly, for to equal the above value, .
The parameterization that yields the simplest functional form of the probability density function sets and . This gives a mean of
and a variance of
The parameter controls the skewness of the distribution. To see this, let denote the mode of the distribution, and
Since , the probability left of the mode, and therefore right of the mode as well, can equal any value in (0,1) depending on the value of . Thus the skewed generalized t distribution can be highly skewed as well as symmetric. If , then the distribution is negatively skewed. If , then the distribution is positively skewed. If , then the distribution is symmetric.
Finally, and control the kurtosis of the distribution. As and get smaller, the kurtosis increases[1] (i.e. becomes more leptokurtic). Large values of and yield a distribution that is more platykurtic.
Moments
Let be a random variable distributed with the skewed generalized t distribution. The moment (i.e. ), for , is:
The mean, for , is:
The variance (i.e. ), for , is:
The skewness (i.e. ), for , is:
The kurtosis (i.e. ), for , is:
Special Cases
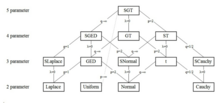
Special and limiting cases of the skewed generalized t distribution include the skewed generalized error distribution, the generalized t distribution introduced by McDonald and Newey,[6] the skewed t proposed by Hansen,[8] the skewed Laplace distribution, the generalized error distribution (also known as the generalized normal distribution), a skewed normal distribution, the student t distribution, the skewed Cauchy distribution, the Laplace distribution, the uniform distribution, the normal distribution, and the Cauchy distribution. The graphic below, adapted from Hansen, McDonald, and Newey,[2] shows which parameters should be set to obtain some of the different special values of the skewed generalized t distribution.
The skewed generalized t distribution tree
Skewed generalized error distribution
The Skewed Generalized Error Distribution (SGED) has the pdf:
where
gives a mean of . Also
gives a variance of .
Generalized t-distribution
The generalized t-distribution (GT) has the pdf:
where
gives a variance of .
Skewed t-distribution
The skewed t-distribution (ST) has the pdf:
where
gives a mean of . Also
gives a variance of .
Skewed Laplace distribution
The skewed Laplace distribution (SLaplace) has the pdf:
where
gives a mean of . Also
gives a variance of .
Generalized error distribution
The generalized error distribution (GED, also known as the generalized normal distribution) has the pdf:
where
gives a variance of .
Skewed normal distribution
The skewed normal distribution (SNormal) has the pdf:
where
gives a mean of . Also
gives a variance of .
The distribution should not be confused with the skew normal distribution or another asymmetric version. Indeed, the distribution here is a special case of a bi-Gaussian, whose left and right widths are proportional to and .
Student's t-distribution
The Student's t-distribution (T) has the pdf:
was substituted.
Skewed Cauchy distribution
The skewed cauchy distribution (SCauchy) has the pdf:
and was substituted.
The mean, variance, skewness, and kurtosis of the skewed Cauchy distribution are all undefined.
Laplace distribution
The Laplace distribution has the pdf:
was substituted.
Uniform Distribution
The uniform distribution has the pdf:
Thus the standard uniform parameterization is obtained if , , and .
Normal distribution
The normal distribution has the pdf:
where
gives a variance of .
Cauchy Distribution
The Cauchy distribution has the pdf:
was substituted.
References
Hansen, B. (1994). "Autoregressive Conditional Density Estimation". International Economic Review. 35 (3): 705–730. doi:10.2307/2527081. JSTOR 2527081.
Hansen, C.; McDonald, J.; Newey, W. (2010). "Instrumental Variables Estimation with Flexible Distributions". Journal of Business and Economic Statistics. 28: 13–25. doi:10.1198/jbes.2009.06161. hdl:10419/79273. S2CID 11370711.
Hansen, C.; McDonald, J.; Theodossiou, P. (2007). "Some Flexible Parametric Models for Partially Adaptive Estimators of Econometric Models". Economics: The Open-Access, Open-Assessment e-Journal. 1 (2007–7): 1. doi:10.5018/economics-ejournal.ja.2007-7. hdl:20.500.14279/1024.
McDonald, J.; Michefelder, R.; Theodossiou, P. (2009). "Evaluation of Robust Regression Estimation Methods and Intercept Bias: A Capital Asset Pricing Model Application" (PDF). Multinational Finance Journal. 15 (3/4): 293–321. doi:10.17578/13-3/4-6. S2CID 15012865.
McDonald, J.; Michelfelder, R.; Theodossiou, P. (2010). "Robust Estimation with Flexible Parametric Distributions: Estimation of Utility Stock Betas". Quantitative Finance. 10 (4): 375–387. doi:10.1080/14697680902814241. S2CID 11130911.
McDonald, J.; Newey, W. (1988). "Partially Adaptive Estimation of Regression Models via the Generalized t Distribution". Econometric Theory. 4 (3): 428–457. doi:10.1017/s0266466600013384. S2CID 120305707.
Savva, C.; Theodossiou, P. (2015). "Skewness and the Relation between Risk and Return". Management Science.
Theodossiou, P. (1998). "Financial Data and the Skewed Generalized T Distribution". Management Science. 44 (12–part–1): 1650–1661. doi:10.1287/mnsc.44.12.1650.
External links
outlines skewed generalized t distribution, its special cases, and a program to calculate its pdf, cdf, and critical values
^ abcdTheodossiou, P (1998). "Financial Data and the Skewed Generalized T Distribution". Management Science. 44 (12–part–1): 1650–1661. doi:10.1287/mnsc.44.12.1650.
^ abHansen, C.; McDonald, J.; Newey, W. (2010). "Instrumental Variables Estimation with Flexible Distributions". Journal of Business and Economic Statistics. 28: 13–25. doi:10.1198/jbes.2009.06161. hdl:10419/79273. S2CID 11370711.
^Hansen, C., J. McDonald, and P. Theodossiou (2007) "Some Flexible Parametric Models for Partially Adaptive Estimators of Econometric Models" Economics: The Open-Access, Open-Assessment E-Journal
^McDonald, J.; Michelfelder, R.; Theodossiou, P. (2009). "Evaluation of Robust Regression Estimation Methods and Intercept Bias: A Capital Asset Pricing Model Application" (PDF). Multinational Finance Journal. 15 (3/4): 293–321. doi:10.17578/13-3/4-6. S2CID 15012865.
^ abMcDonald J., R. Michelfelder, and P. Theodossiou (2010) "Robust Estimation with Flexible Parametric Distributions: Estimation of Utility Stock Betas" Quantitative Finance 375-387.
^ abMcDonald, J.; Newey, W. (1998). "Partially Adaptive Estimation of Regression Models via the Generalized t Distribution". Econometric Theory. 4 (3): 428–457. doi:10.1017/S0266466600013384. S2CID 120305707.
^Savva C. and P. Theodossiou (2015) "Skewness and the Relation between Risk and Return" Management Science, forthcoming.
^Hansen, B (1994). "Autoregressive Conditional Density Estimation". International Economic Review. 35 (3): 705–730. doi:10.2307/2527081. JSTOR 2527081.
![{\displaystyle f_{\text{SGT}}(x;\mu ,\sigma ,\lambda ,p,q)={\frac {p}{2v\sigma q^{\frac {1}{p}}B({\frac {1}{p}},q)\left[1+{\frac {|x-\mu +m|^{p}}{q(v\sigma )^{p}(1+\lambda \operatorname {sgn}(x-\mu +m))^{p}}}\right]^{{\frac {1}{p}}+q}}}}](https://wikimedia.org/api/rest_v1/media/math/render/svg/e1759bad99e5cea389857886f97ae66b016fab9e)


![{\displaystyle E[(X-E(X))^{h}]}](https://wikimedia.org/api/rest_v1/media/math/render/svg/2689202585a1c40738d9b5214219f9f77f7dcf08)


![{\displaystyle E[(X-E(X))^{2}]}](https://wikimedia.org/api/rest_v1/media/math/render/svg/8ddf7d92a1c2f7e74e527a47f375a2eb351230b0)

![{\displaystyle E[(X-E(X))^{3}]}](https://wikimedia.org/api/rest_v1/media/math/render/svg/9fae47d6525887ba6b2747b1c0d78e90219b935e)


![{\displaystyle E[(X-E(X))^{4}]}](https://wikimedia.org/api/rest_v1/media/math/render/svg/4e3ac349fa0833184587b4786e617fa2462273cb)


![{\displaystyle =f_{\text{SGED}}(x;\mu ,\sigma ,\lambda ,p)={\frac {p}{2v\sigma \Gamma ({\frac {1}{p}})}}e^{-\left({\frac {|x-\mu +m|}{v\sigma [1+\lambda \operatorname {sgn}(x-\mu +m)]}}\right)^{p}}}](https://wikimedia.org/api/rest_v1/media/math/render/svg/e310546fb7214ec98f70b14fcd700ccf4be04e55)


![{\displaystyle =f_{\text{GT}}(x;\mu ,\sigma ,p,q)={\frac {p}{2v\sigma q^{\frac {1}{p}}B({\frac {1}{p}},q)\left[1+{\frac {\left|x-\mu \right|^{p}}{q(v\sigma )^{p}}}\right]^{{\frac {1}{p}}+q}}}}](https://wikimedia.org/api/rest_v1/media/math/render/svg/b77d20dc933e73c82cc09c7f851d8f99330ab4d2)


![{\displaystyle =f_{\text{ST}}(x;\mu ,\sigma ,\lambda ,q)={\frac {\Gamma ({\frac {1}{2}}+q)}{v\sigma (\pi q)^{\frac {1}{2}}\Gamma (q)\left[1+{\frac {\left|x-\mu +m\right|^{2}}{q(v\sigma )^{2}(1+\lambda \operatorname {sgn}(x-\mu +m))^{2}}}\right]^{{\frac {1}{2}}+q}}}}](https://wikimedia.org/api/rest_v1/media/math/render/svg/e7a36ce394f0fc92c7540a0342d7857fe5a1d199)


![{\displaystyle v=[2(1+\lambda ^{2})]^{-{\frac {1}{2}}}}](https://wikimedia.org/api/rest_v1/media/math/render/svg/2adf227609d7380639991940b14a983af872a202)


![{\displaystyle =f_{\text{SNormal}}(x;\mu ,\sigma ,\lambda )={\frac {1}{v\sigma {\sqrt {\pi }}}}e^{-\left[{\frac {|x-\mu +m|}{v\sigma (1+\lambda \operatorname {sgn}(x-\mu +m))}}\right]^{2}}}](https://wikimedia.org/api/rest_v1/media/math/render/svg/8043b47ba89605cd8fa89cbdf9d8dacf6508ce28)


![{\displaystyle =f_{\text{SCauchy}}(x;\mu ,\sigma ,\lambda )={\frac {1}{\sigma \pi \left[1+{\frac {\left|x-\mu \right|^{2}}{\sigma ^{2}(1+\lambda \operatorname {sgn}(x-\mu ))^{2}}}\right]}}}](https://wikimedia.org/api/rest_v1/media/math/render/svg/3f4337331a58f33f58ebcccbb22e4edfd06ef20d)


![{\displaystyle =f_{\text{Cauchy}}(x;\mu ,\sigma )={\frac {1}{\sigma \pi \left[1+\left({\frac {x-\mu }{\sigma }}\right)^{2}\right]}}}](https://wikimedia.org/api/rest_v1/media/math/render/svg/d8555a13b2843acaed8580af5159c38c6420118e)
 Category
 Commons


